Serenity Dome Cold Study Data
A Year of Energy Data for a Monolithic Dome
Editor’s Note: In 2010, Maddy and Chris Ecker moved into their Monolithic Dome home in Galax, Virginia. It’s an oblate ellipse built on a two-foot stemwall, with a diameter of 50 feet and a living area of 2675 square feet. The Eckers have carefully documented their dome-home’s performance and share their findings with us.
Read Chris Ecker’s original story: The Original Cold Study
Read Chris Ecker’s follow-up story: The Cold Study Follow Up
A Twelve Month Study
After forwarding two partial-year energy studies to share with you through Monolithic, we’ve finally gathered 12 months of utility usage for our Monolithic Dome (MD). We enhanced the efficiency of our MD by installing a modest photovoltaic (PV) solar array and an outdoor wood stove.
Maddy has named our MD Serenity Dome and, admittedly, saving utility dollars does provide peace of mind. It’s odd to anticipate receiving an electric bill, but I do since we began living in our MD. A recent correction to our double-wide trailer data has further illustrated the efficiency of our MD before and after our recent system additions (*1).
Our MD was retrofitted with a utility approved digital net meter at the service connection to provide for a grid-tie. The net meter measures our monthly utility use and energy harvested by our PV array which is either used immediately, stored in batteries or returned to the utility. For PV failures or extended days without sunshine we retained our gasoline generator connection.
When the PV system was newly installed, I accidentally turned off the utility feed and unknowingly ran our dome exclusively on PV and battery power for about 30 hours. The batteries eventually auto-tripped off when they reached 50% full. Since we were unaware that we were solely on battery power, we made no concessions to save electricity.
With the battery-operated-dome episode behind us, Maddy and I estimate that we could easily handle 72 hours comfortably during a cold weather utility outage, and pretty much live normally with average sunshine in warmer months. We didn’t learn about a couple of power outages our neighbors experienced last year until they told us about them. Also, we’ve had one tornado per year within 50 miles of our dome even though we live along the Blue Ridge Parkway.
Dome living certainly decreases the danger and damage to the utility and homes should we encounter a tornado on our property.
For the colder months of this energy study, we depended on our outdoor wood stove for heat. We opted for wood fuel because we’re surrounded by plenty of wooded property. Besides, oil and gas haulers don’t like to truck through the mountains when fuel is needed the most – never mind the continued price hikes.
Hot water from the wood stove heats a set of coils in an air handler. Heated air is then blown throughout the dome through our ERV (also known as HRV) duct work, but not during ERV use. Strategically placed in-line dampers prevent air from backing up into either unused system. To supplement our hot water, we store hot water in a modified domestic hot water tank. It has no electrical hookup, but instead heats water with a heat exchanger that incorporates hot wood stove water. By pumping tanked, pre-heated water through our demand water heaters in the main bath and laundry, we minimized the electric demand to heat water when the wood stove was in use.
For warmer months, we used one window mounted 8,000 BTU air conditioner in the main living area. Ceiling fans, strategically closed curtains and ERV use augmented the AC and kept us comfortable.
Since our PV system charge controller cycles the utility and batteries continuously during the day, I wasn’t convinced we would maximize utility savings by using the AC only at night to charge our dome shell with cool air. That is, the utility might be used during the day, or might be replaced one-for-one by solar energy during the day, but must be used at night. This allowed us to use the AC when we felt it was needed, day or night.
During sunny months, the PV system generated approximately 1/5 of our total electric usage. This solar power was credited back to us and subtracted from our utility bill.
Historically the winter months are cloudy here in the mountains. These overcast days combined with the shorter daylight hours reduced our solar harvest, but there was still enough sunshine to give us active and passive solar gains through the PVs and our 12-foot sliding glass door which faces south.
Despite the shorter cloudy days, we still managed to generate a few extra kilowatt hours of electric. Since the dome shell held temperature stable for 24 – 48 hours, we didn’t need to keep our outdoor wood stove burning everyday, especially in the late fall and early spring.
When our PV system was installed, we decided not to sell back solar credits to a government brokered clearinghouse because we didn’t want a government hook in our wallet. What the government gives, the government will regulate and might just take back. Also, it didn’t make sense to receive money from the federal government, which is bankrupt, while paying our taxes; we were either paying ourselves in a roundabout way, or we would be receiving money that Uncle Sam borrowed from overseas. Either way we would be taxed on the additional income, however small.
That said, we did take advantage of the Residential Energy Credit when we filed federal taxes. The Commonwealth of Virginia doesn’t offset residential alternative or renewable energy, but many states do. Be sure to ask your CPA if you ever go forward with similar projects. It’s worth repeating that beyond living in an extremely efficient Monolithic Dome, we received a reduced monthly utility bill that saves us money on a monthly basis.
The 2011-2012 weather and temperatures were mild and average during our data-collection period. Summer months maxed out in the 80s F while the cold months proved to be fairly tame with little ice or snow. Average monthly temperatures are logged on the data spreadsheet as reported by our utility company, Appalachian Power Company, aka APCo.
We used the wood stove from November through March as needed. In contrast, during the 2010-2011 winter months, we opted for three or less electric space heaters only, for dome heating.
As an aside, we saw no significant impact on heating efficiency, nor a drop in utility cost when we ran an infrared (or radiant) heater. Sadly these are touted as being highly efficient and often Amish-crafted. Neither was true based on our purchase and usage (*2).
We also observed that the space heaters kept interior dome temps around 68 F, while the wood stove easily kept us at 72-74 F. It probably wasn’t fair to expect space heaters to handle the volume of a dome, but it proved an interesting comparison, especially to see the increased electric demand from these heaters.
Habits and Lifestyle
As far as our habits and lifestyle, we use widely available Energy Saver electric appliances and try to be reasonable with our electric consumption. We don’t use natural gas, oil or propane to fuel interior appliances or gadgets.
There are two adults, two dogs and 17 chickens living here. What the chickens require in winter heat lamp usage is more than adequately paid back with fresh eggs. There simply isn’t anything extravagant on the property — well, OK, there’s our MD, but we consider the dome more practical than extravagant.
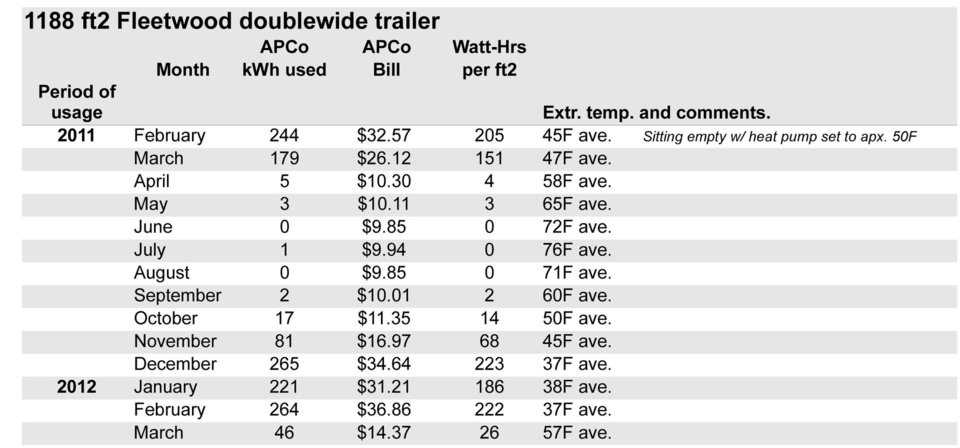
We’ve provided all pertinent dome data on one sheet and comparison data of what energy was required to keep our unoccupied double wide trailer from freezing during the same winter time period on a second spreadsheet. Understanding that no one will have exactly the same use, our data will give you an honest assessment of our MD utility usage.
Of Interest:
The US Energy Information Administration (EIA) published studies for 2009 and 2010 that reflect the average Virginian home used 1170 and 1239 kWh’s per month respectively, with an average utility cost of $124 and $129. There was no average home square footage provided in this data. In contrast, even with wood stove use in cold weather, we averaged 715 kWh’s demand per month for 2011 through 2012 – not including solar offsets.
And our monthly bill averaged just under $67 for this period, after credits. Kind of crazy, isn’t it? You’ll find our highest and lowest data indicated on the first spreadsheet.
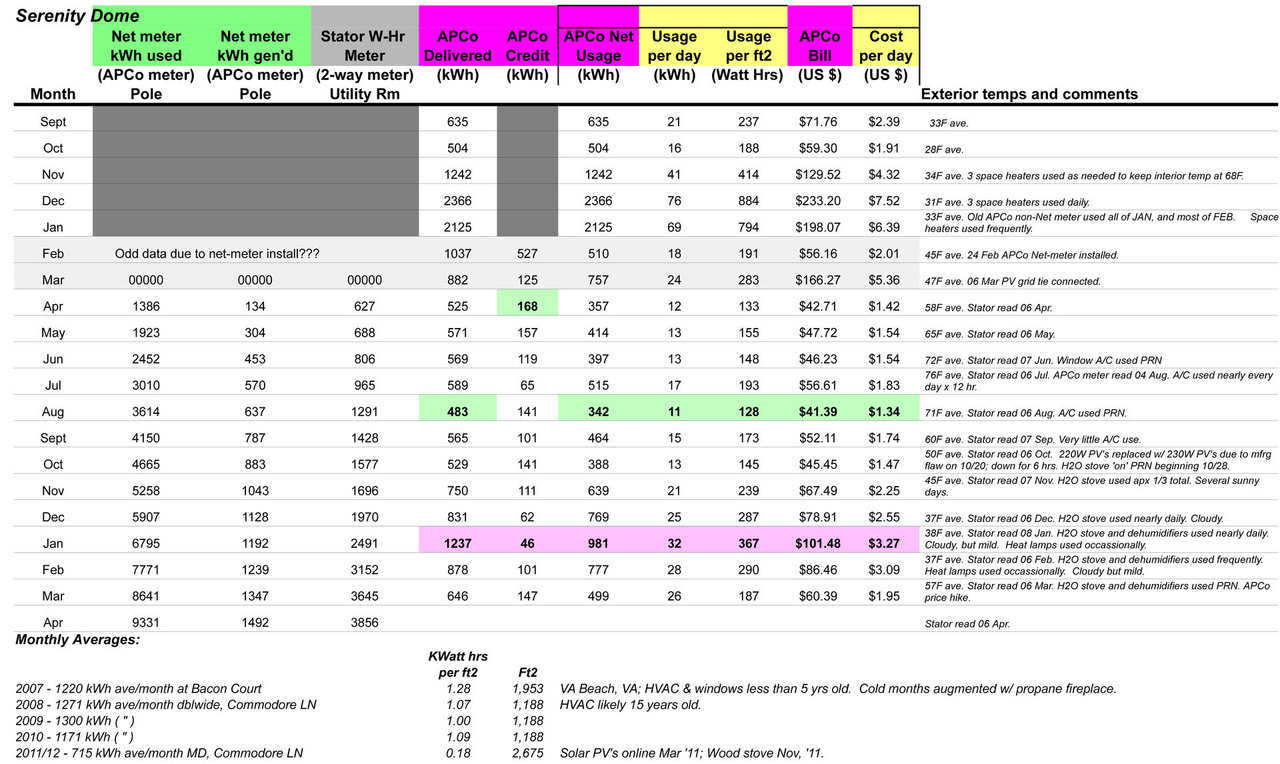
Our Data
The tabulated columns on the first spreadsheet contain the following data:
Net meter kWh used – APCo meter reading of our cumulative gross monthly electric consumption.
Net meter kWh gen’d – APCo meter reading of cumulative monthly electric that we generated and returned back to APCo, aka harvested electric.
Stator W-Hr Meter – Our analog electric meter that houses a bi-directional spinning disk. Besides forward and backward movement, the disk will stand still when electrical demand and usage are equal. The charge controller has as much to do with this data as do the energy we used and returned.
APCo (bill) Delivered – Total kWh per month electric delivered to us.
APCo (bill) Credit – Total kWh per month electric harvested by our PV system and returned to APCo.
APCo (bill) Net Usage – APCo (gross) Delivered minus APCo Credit. This is the amount of electric for which we were charged each month.
Usage per day – APCo Net Usage divided by days in calendar month.
APCo bill – Actual price the utility company charged us for utility delivered minus utility credit.
Cost per day – APCo Bill divided by days in calendar month.
There is some additional data at the bottom of this first spreadsheet that reflects our monthly electric usage from 2007 through this study. The first line is from our brick-and-stick house in Virginia Beach, VA. This entry includes an added 600-square-foot attic; the attic space is not included in the comparison below and would have required more energy to heat and cool.
The second spreadsheet records our double wide data and is fairly straight forward. Billing periods were the same as the first spreadsheet.
A Summary of Our Findings
The first 12 months from PV system install until February 2012, our total demand was 8,641 kWh’s for our MD. During this same period, we bought 1,038 kWh’s for the unoccupied double wide trailer. The double wide demand was 15,611 kWhâ’s for our final year of occupancy. Comparable annual demand in our 1,353 square foot, brick-and-stick home in Virginia Beach for 2004 was 12,993 kWh’s. Lastly with the modest PV and wood stove systems added to our MD, we generated and sold back 1347 kWh’s from 3/11 to 2/12, leaving us with a net usage of 7,294 kWh’s.
Here’s a comparative look at these annual energy demands:
Double wide trailer unoccupied – 0.873 kWh per square foot;
Double wide trailer occupied – 13.141 kWh per square foot;
Brick-&-stick standard construct – 9.603 kWh per square foot;
MD without added efficiencies – 3.230 kWh per square foot;
MD with PV and wood furnace – 2.727 kWh per square foot.
The MD – without added systems – used 1/3 of the electric needed compared to our brick-and-stick built home is Virginia Beach!
At this writing
We’ve just now attempted to study the system(s) payback. If we use the above figures, our MD electric demand was just 1/3 the demand of our standard constructed home. That works out to about $1800 saved for electric usage over the first 12 months following our PV install in the MD. If this model is projected into the future, we’ll have our system paid-off in less than 13 years. One could argue that our PV system will lose efficiency over time, but I’ll hedge that utility costs will rise just as fast (or faster) over the same period – so I’ll stick with the 13-year model.
Stator Data
Now I’ll try to complicate things by inserting the Stator data. If you take a particular month’s cumulative gross Net Meter kWh used, then subtract the corresponding cumulative Net Meter kWh generated, you end up with a cumulative net usage – this much is certain. If you then subtract that same month’s Stator reading from the new cumulative net usage, you should end up with the kWh equivalent of utility equilibrium. That is, we were neither taking from, nor giving to the utility. This means all electric consumption was coming directly from our PV array (or battery equalization).
I have not tabulated this data on the spread sheet, but after 13 months of cumulative data, February 2012 provides these figures:
(7771 kWh used) – (1239 kWh gen’d) = (6532 kWh net usage)
(6532 kWh net ) – (3152 kWh Stator reading) = (3380 kWh equilibrium equivalent).
So not only do we have a super energy efficient dome, but we sell back unused, unstored energy to the utility, and we often feed directly from the PVs. If I recalculate system(s) payback factoring in this equilibrium equivalent, our PV system pays for itself in about ½ the time previously noted, or about 6 or 7 years. This PV system efficiency simply would not and could not be as radical without the foundation of working in tandem with our MD. The combination of MDs and a PV system almost becomes synergistic.
Here are some pertinent statistics for this study:
Structure – 50’ Monolithic Dome, Callisto-style 2/5 oblate ellipse on a 2-foot stem wall.
Volume – 28,700+ cubic feet.
Square Footage – will vary by floor plan; ours is 2,675 sq. ft.
Thermal Battery – 103 cubic yards of concrete in the shell wall and slab.
Solar PV system:
8 each – 6V, 225Amp/hr deep cell batteries by Crown Battery, wired as 48V,
12 each – 220 watt PV panels by Grape Solar (*3),
Outback Power FLEXPower inverter and charge controller.
Waterstove system:
500 gallon water stove by Hick’s Waterstoves,
91K BTU water-to-air heat exchanger,
1,000 cfm air handler,
50 gallon domestic water heater.
It is noteworthy:
My past includes working in and managing maintenance. This background has served me well. Adding components or systems will increase the complexity of operating your MD. The maintenance that we perform certainly isn’t too difficult, but it pays to be organized and handy. It also helps to let the dome and weather work for you. With a little practice and an eye on the weather forecasts, you’ll get the hang of operating your dome at your location, with or without added systems. Enjoy your savings and be sure to share your data with Monolithic so we all can learn.
| References and Resources: | |
| www.monolithic.com | World’s leading resource for thin shell monolithic domes! |
| www.crownbattery.com | International battery sales. |
| www.dsireusa.org | Database of State Incentives for Renewable Energy; federal and state incentives. |
| www.grapesolar.com | US assembled PV panels and more. |
| www.hickswaterstoves.com | Waterstoves and solar water heating units, Mount Airy, NC. |
| www.outbackpower.com | Inverters, charge controllers and more. |
| www.sustainableenergysystems.net | Our highly recommended contractor, designer and installer, Zayn Bradley. |
| http://205.254.135.24/consumption/residential/methodology/2009/brief.cfm | EIA methodology for data collection of household energy usage. |
| http://205.254.135.24/tools/faqs/faq.cfm?id=97&t=3 | EIA information on average energy usage for 2010. |
| Footnotes: |
| (*1) Our purchase appraisal conducted through Freddie Mac affiliate Straub Appraisal Services of Blacksburg, VA, listed the double wide as 46′ × 28′ for 1288 sq. ft. My physical measurement of the double wide was 44′ × 27′ for 1188 sq. ft. Our original double wide data was inadvertently padded by an additional 100 sq. ft. This correction shows the efficiency margin to be even bigger between our Monolithic Dome and double wide trailer. |
| (*2) For infrared heater info go to; http://www.nlcpr.com/Deceptions4.php |
| (*3) Upgraded to 12 ea. 230 watt panels following original panel recall due to lamination clouding; this may have decreased our initial solar harvest. The change increased our array from 2.64 kW to 2.76 kW. Grape Solar and (especially) our contractor Zayn Bradley made this transition seamless. |
Double Wide Trailer Cold Study Data