R-value Fairy Tale: The Myth of Insulation Values

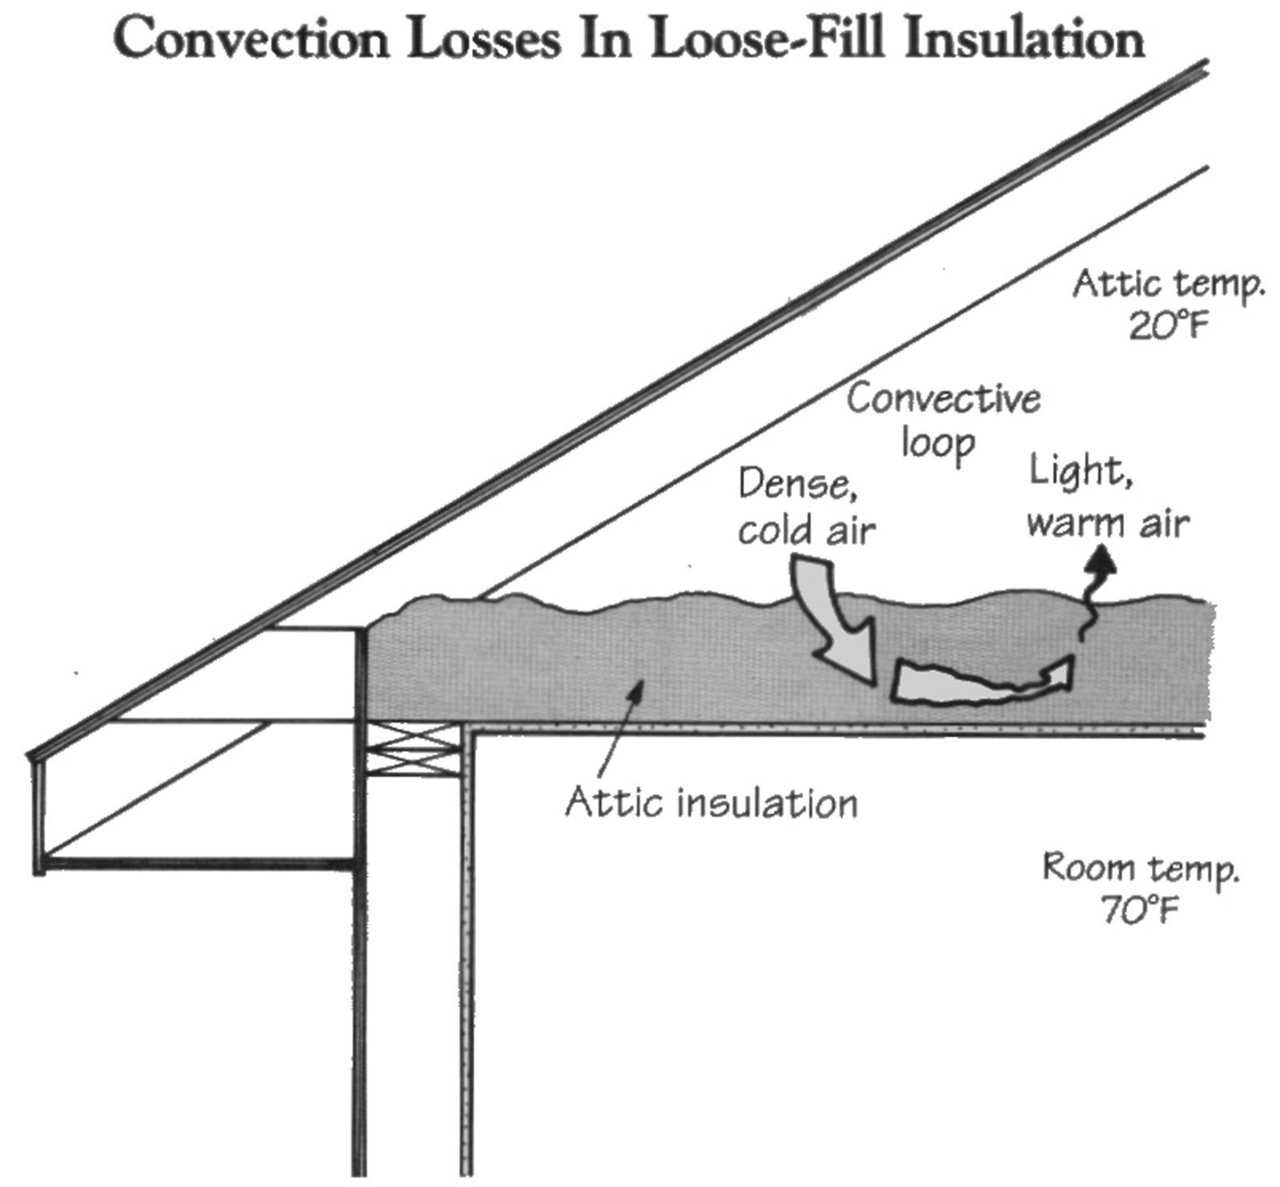
Figure 2.2 — At very cold temperatures, when the temperature difference across the attic insulation reaches a certain critical point, convection within the insulation can reduce r-value (J.D. Ned Nisson, “Attic Insulation Problems in Cold Climates,” Energy Design Update, March 1992, 420-43)
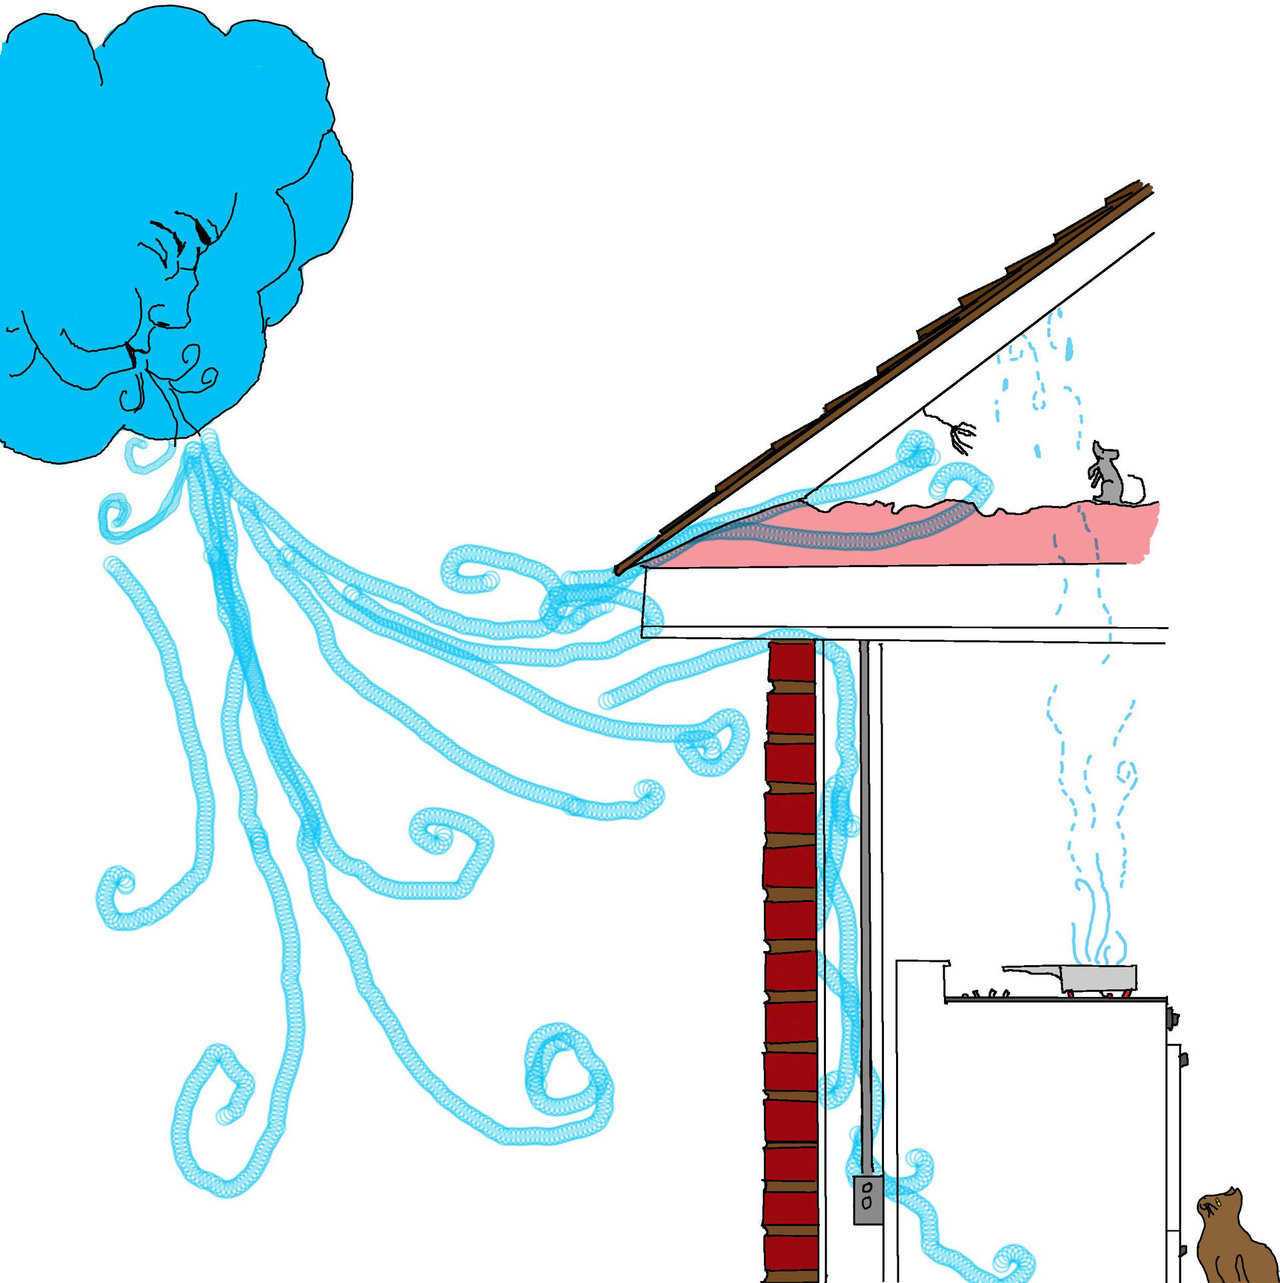
Figure 2.3 — Air penetration through walls and roof of a home with standard insulation.
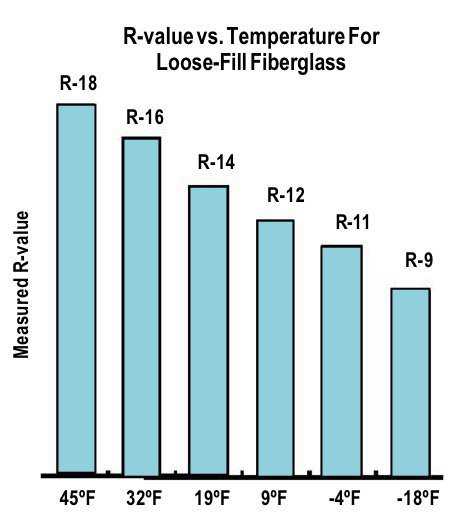
Figure 2.4 — There is a problem with loose-fill fiberglass attic insulation in cold climates. It appears that , as attic temperature drops below a certain point, air begins to circulate into and within the insulation, forming “convective loops” that increase heat loss and decrease the effective R-value. At very cold temperatures (-20F), the R-value may decrease by up to 50%.
In full-scale attic tests at Oak Ridge National Laboratory, the R-value of 6 inches of cubed loose-fill attic insulation progressively fell as the attic air temperature dropped. At -18F, the R-value measured only r=9. The problem seems to occur with any low-densitiy, loose-fill fibrous insulation. (J.D. Ned Nisson, “Attic Insulation Problems in Cold Climates,” Energy Design Update, March 1992, 42-43)
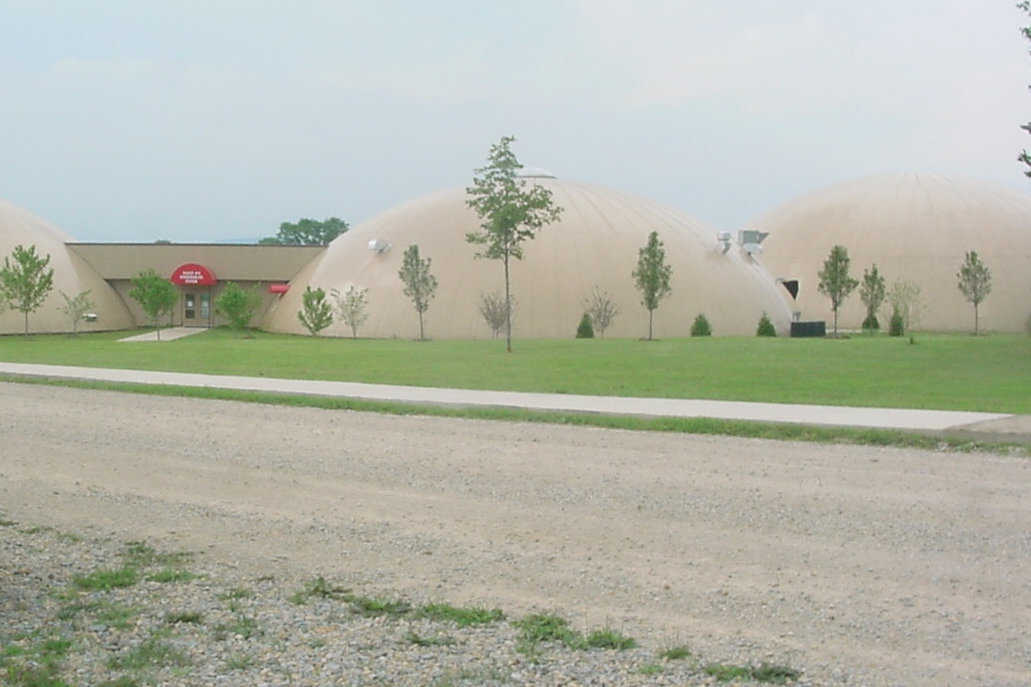
Fig 2.5 — During the 2007-2008 winter, Caledonia, Missouri experienced ice and wind storms that covered their area with two to three inches of ice and left people without power for up to two weeks. Superintendent Steve Yount said that the domes were unaffected by the cold, and, although they were without power, the domes retained their heat, so people spent their days warming up in the Monolithic Domes. The community wants their domes certified by the Red Cross as a designated disaster shelter and is looking into grants that would finance a generator.
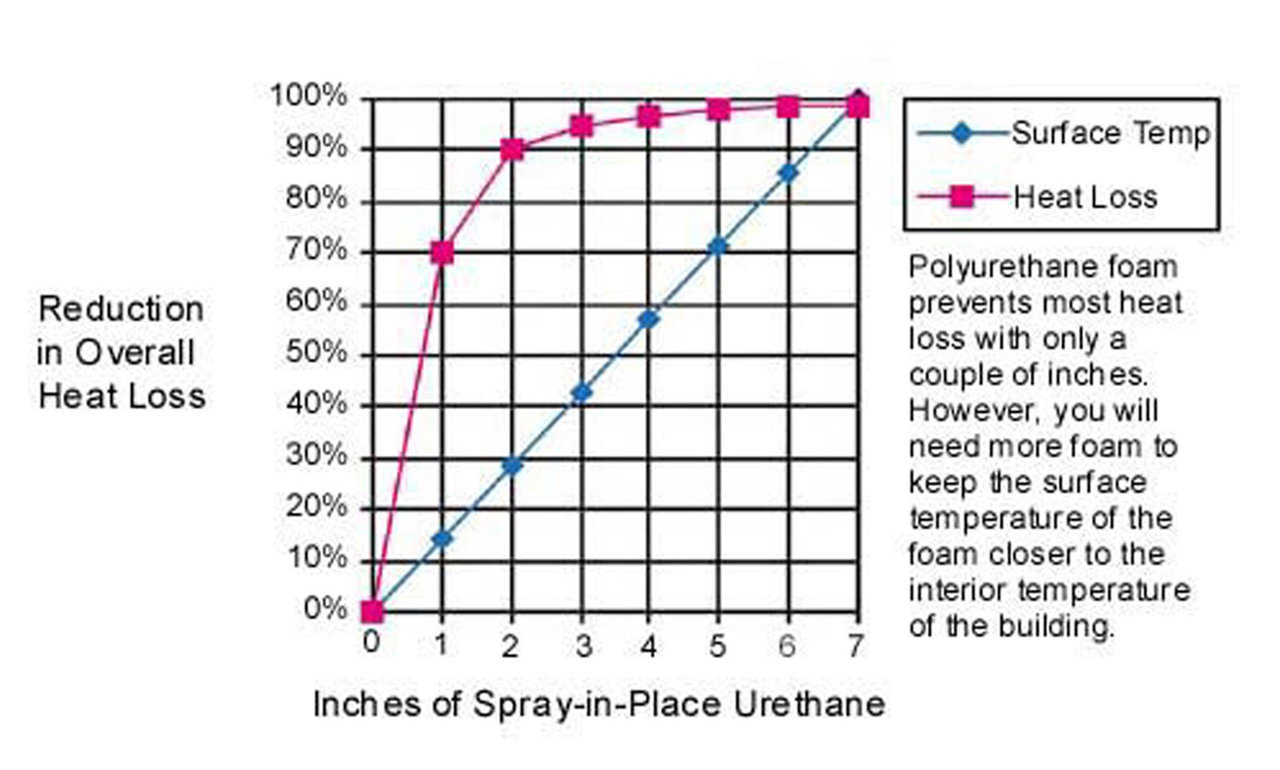
Figure 2.7 — This graph illustrates a building’s reduction in heat loss when it is insulated with various thicknesses of spray-in-place urethane foam. Note: above 3 inches, the insulation benefit tops off quickly. The graph is not exact, but it shows, in general, what happens as additional insulation is added to the surface temperature. In other words, by super-insulating, the surface temperature of the inside of the exterior walls comes very close to the room temperature. This prevents condensation, that, in turn, prevents mold growth.
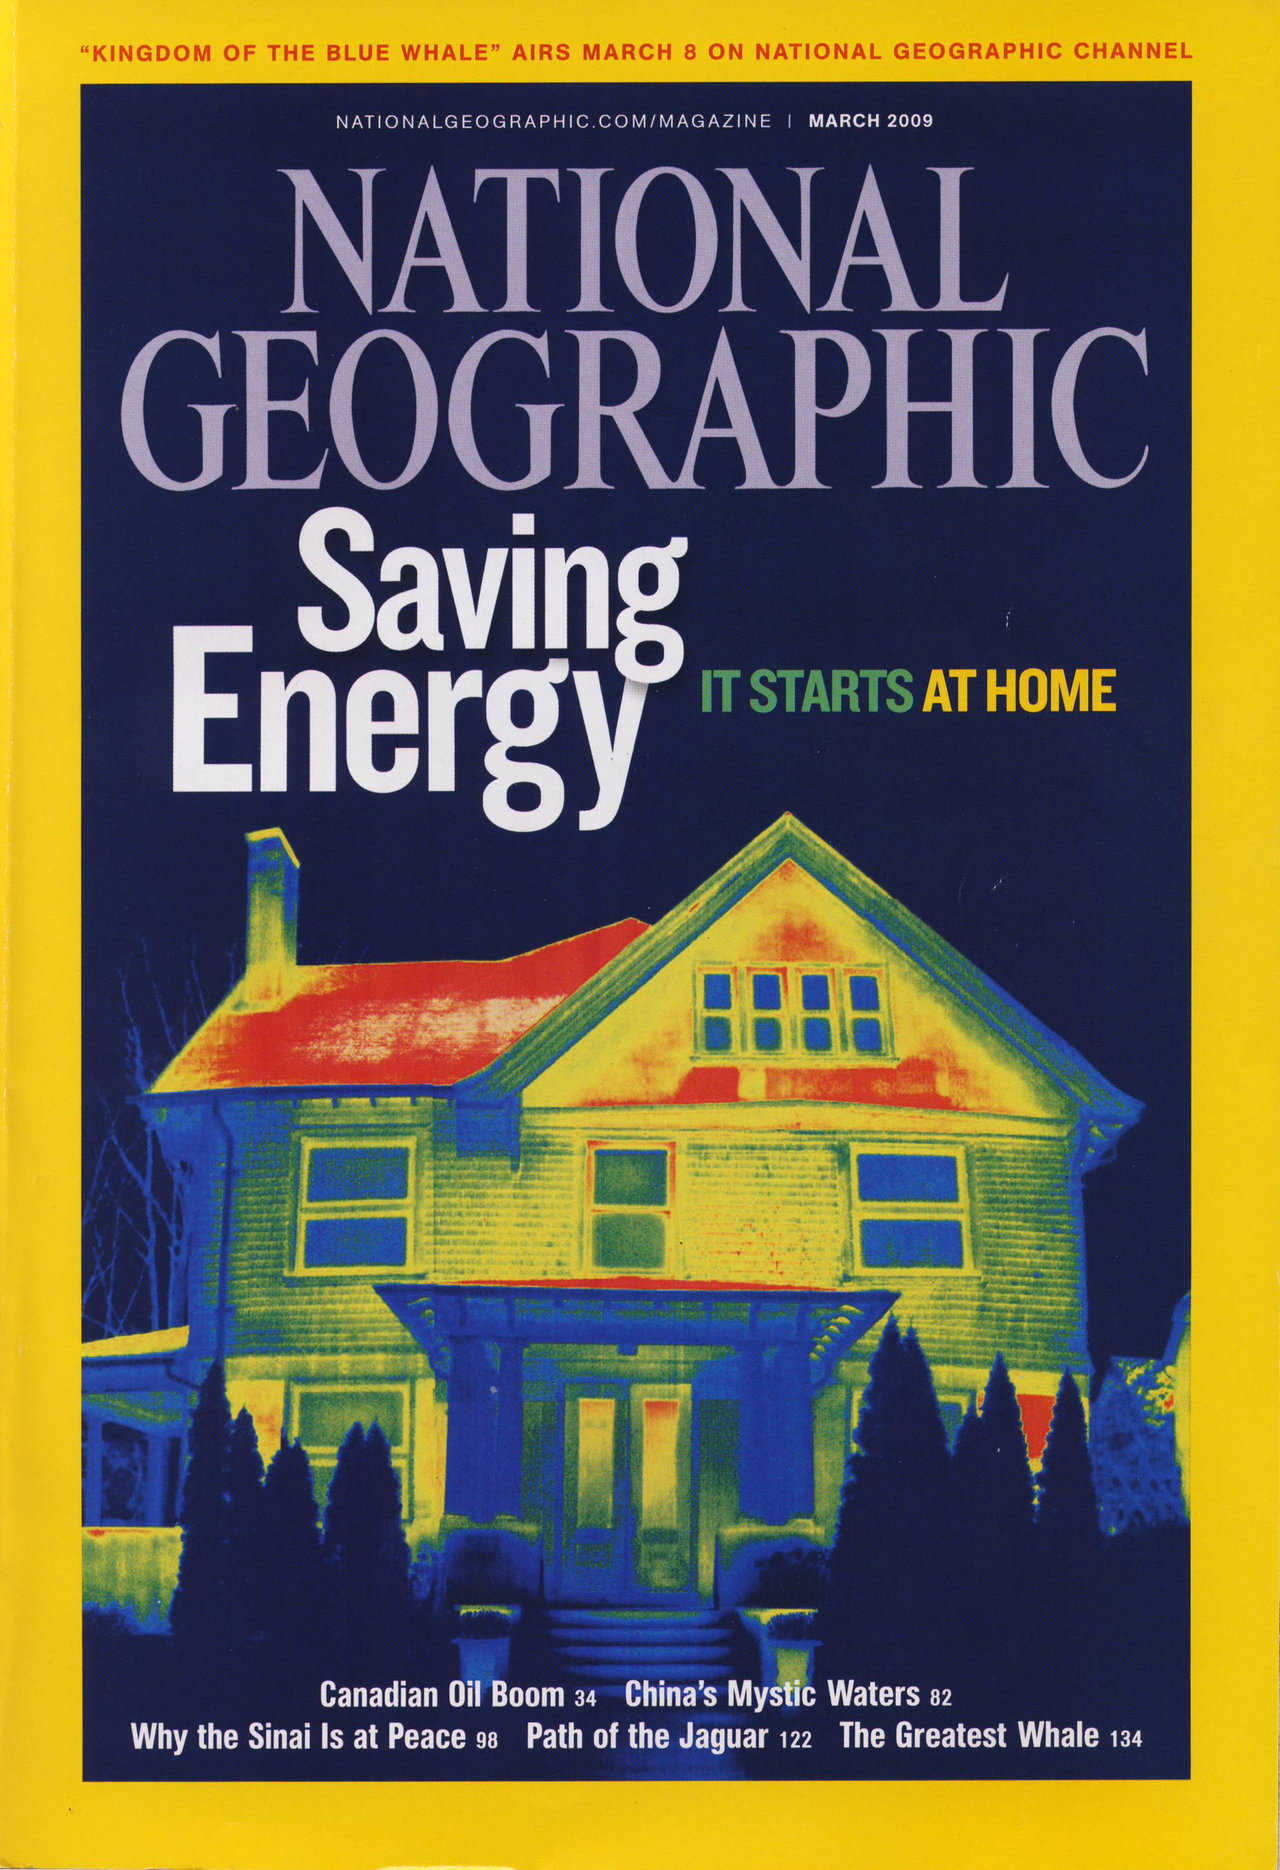
Figure 2.8 — March 2009 National Geographic features thermograph of conventionally insulated home. Note heat loss, especially through the roof.
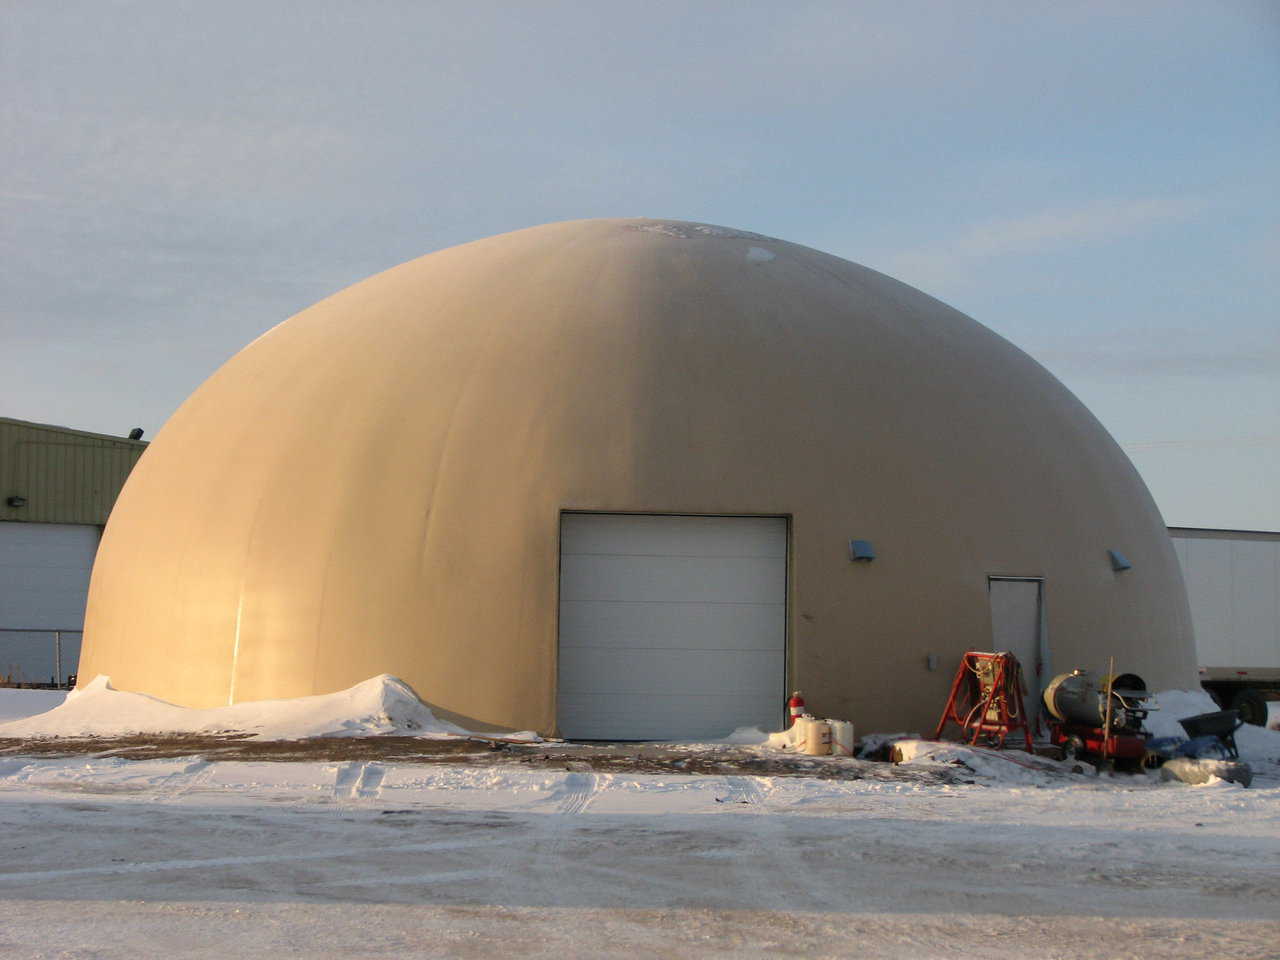
Figure 2.9 — Heated Monolithic Dome shop in Sasketoon, Saskatchewan, Canada. The outside temperature at this time was 13 degrees Fahrenheit below zero (-25C). This is a standard color photograph taken by a standard camera. Note the metal buildings in the background.
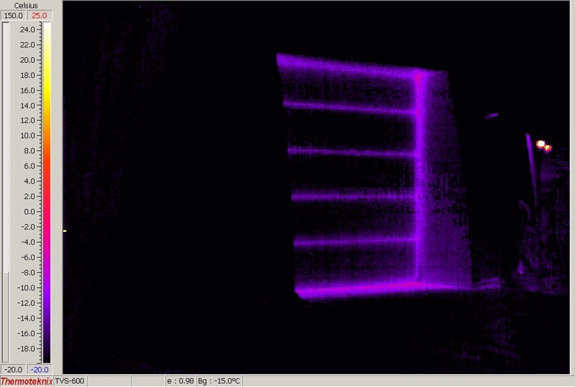
Figure 2.10 — This picture shows the same Monolithic Dome through the thermographic camera at the same 13 degrees F below zero. Note the Monolithic Dome is black. This is a heated shop. There is no heat loss through the dome shell. The door (insulated) is leaking heat, especially at the cracks between the sections and along the edges.
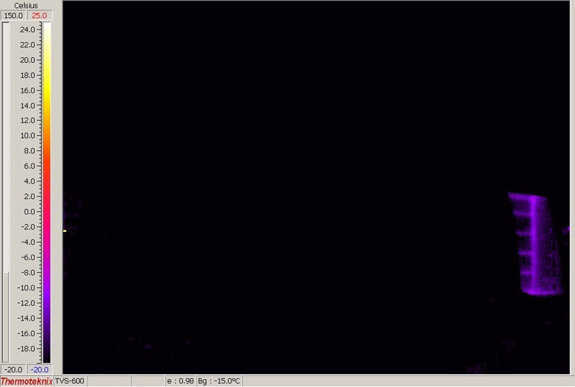
Figure 2.11 — Same building, same situation bur further around the building. Note the temperatures on the side bar. The black is about 25 degrees Celsius below zero (-13F). The colors denote higher temperatures.
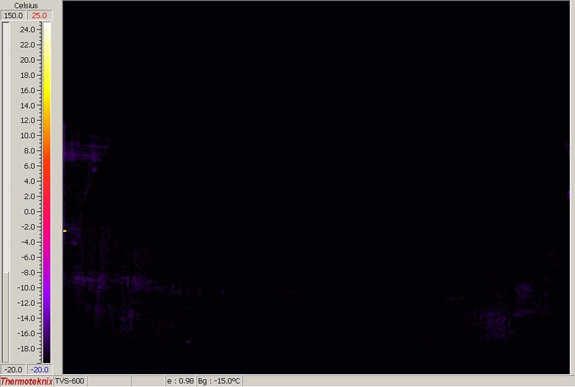
Figure 2.12 — The back side of the Monolithic Dome shows virtually no heat loss as there is no color.
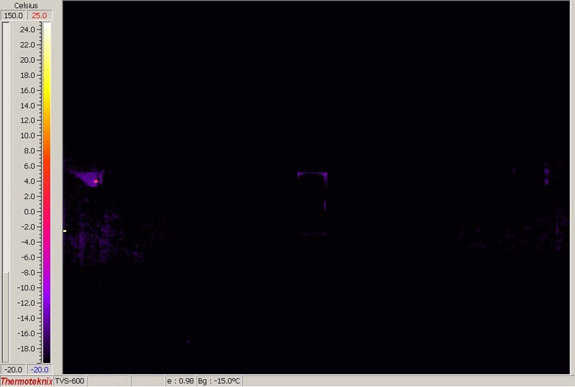
Figure 2.13 — Another thermograph taken of the west face of the dome. Note the small amount of heat loss around the personnel door.
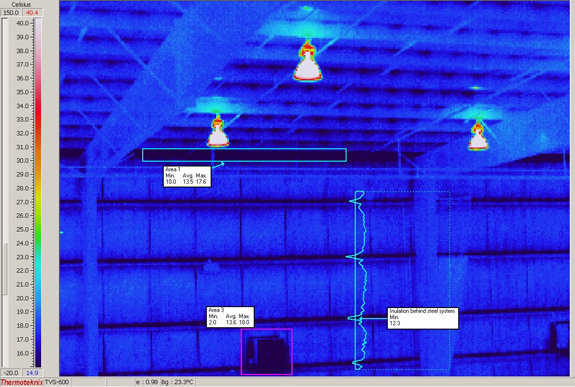
Figure 2.14 — Internal image of the shop next door to the Monolithic Dome shop. Note the black areas. This is the -25C (-13F) temperature showing on the inside of the building. This insulated building shows virtually no insulation along the metal framing.
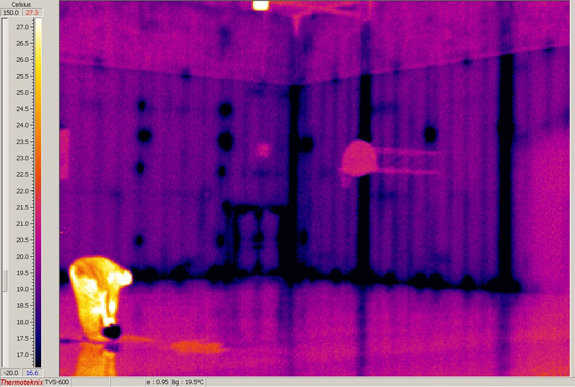
Figure 2.15 — Internal image of a metal by gymnasium near by. Note the bright colors of the student and the below-zero colors of the exterior walls.
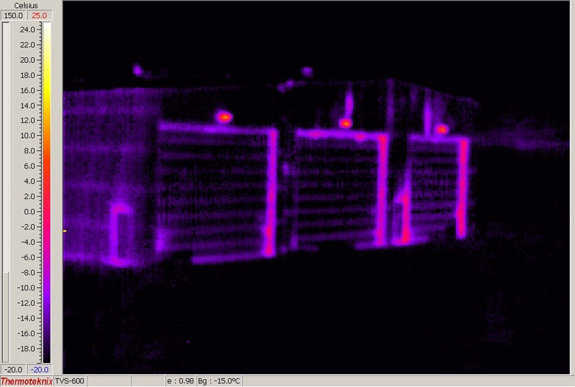
Figure 2-16 — This thermograph is of a 1980 vintage metal building that is considered well insulated. The picture indicates this is true for a metal building. But even this well-insulated building shows heat loss.
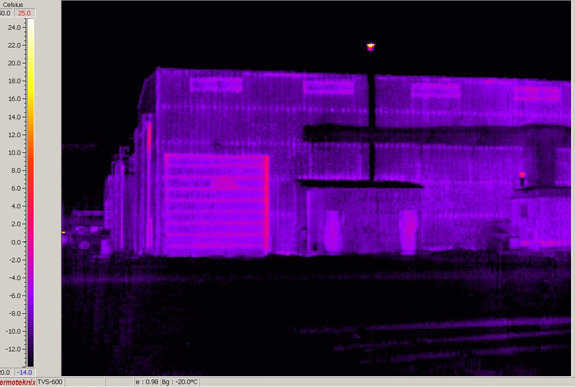
Figure 2.17 — Another metal shop building adjacent to the dome. Note the brighter colors indicate more heat loss (obviously) than that of the super-insulated Monolithic Dome.