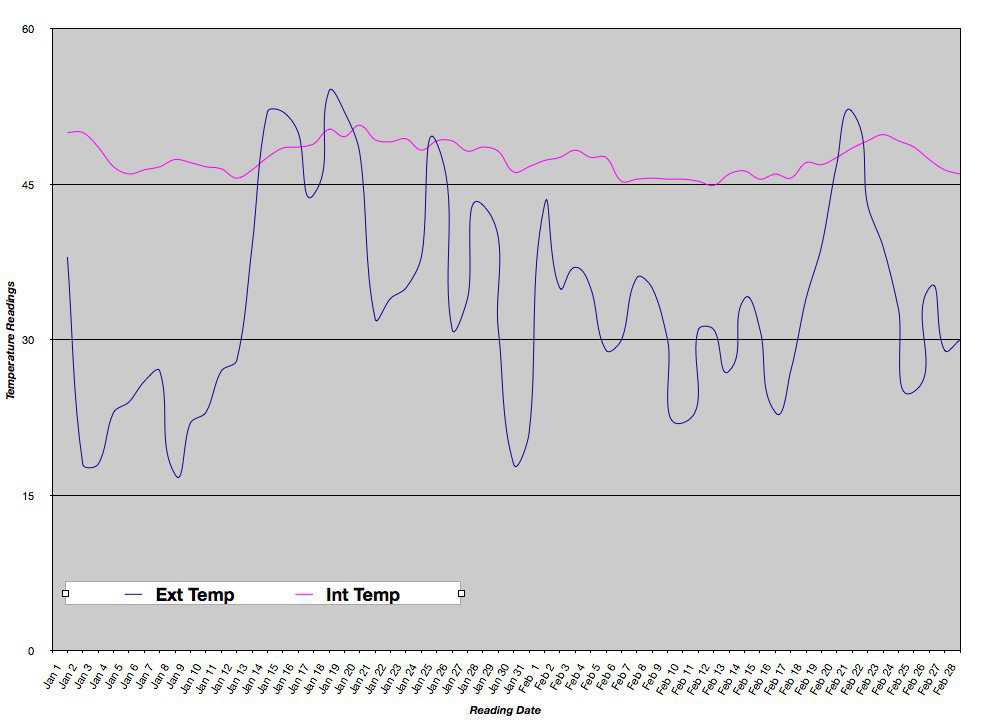
Charted data — Graph records daily interior temperatures (pink line) and exterior temperatures (blue line). Note the stability of the Monolithic Dome’s inside temperature. (Chris Ecker)