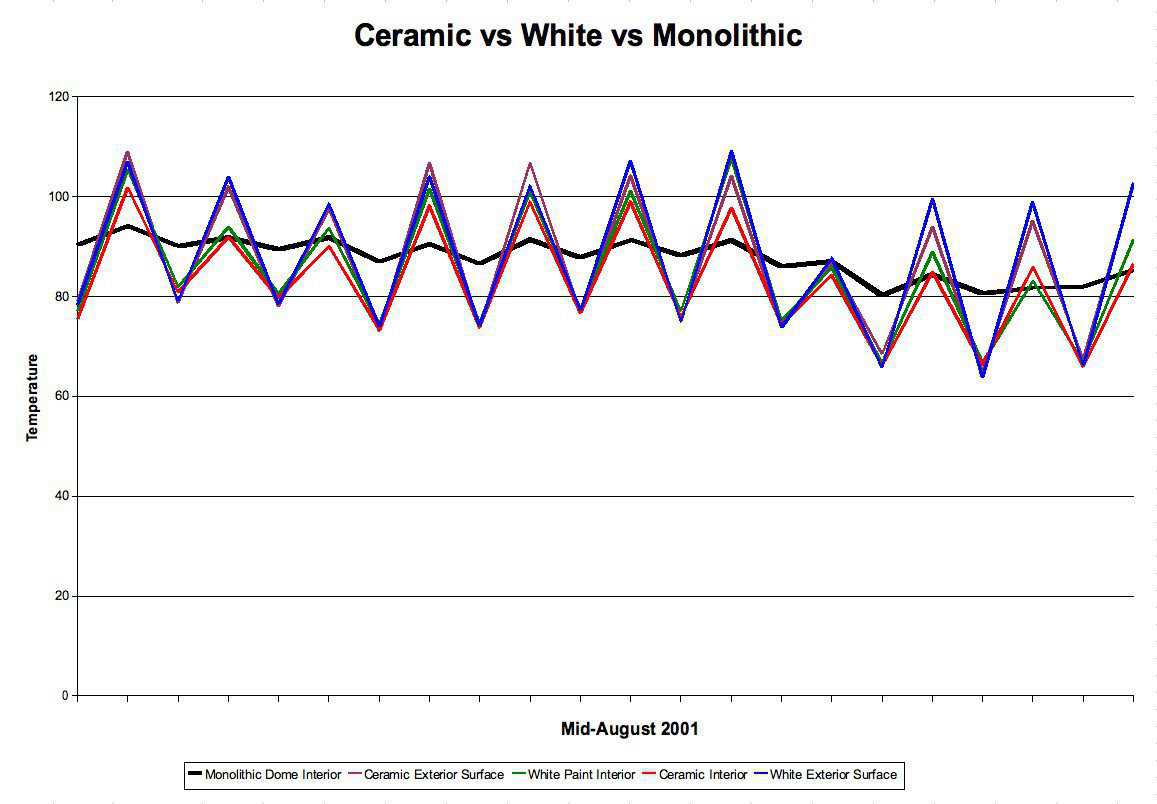
Ceramic vs White — This graph is typical of all data gathered during the summer 2001. This data does not take into account any temperature measurement errors. Our thermometers were not calibrated. Please allow a 2-3 degree variation in the readings. (David South, Jr.)