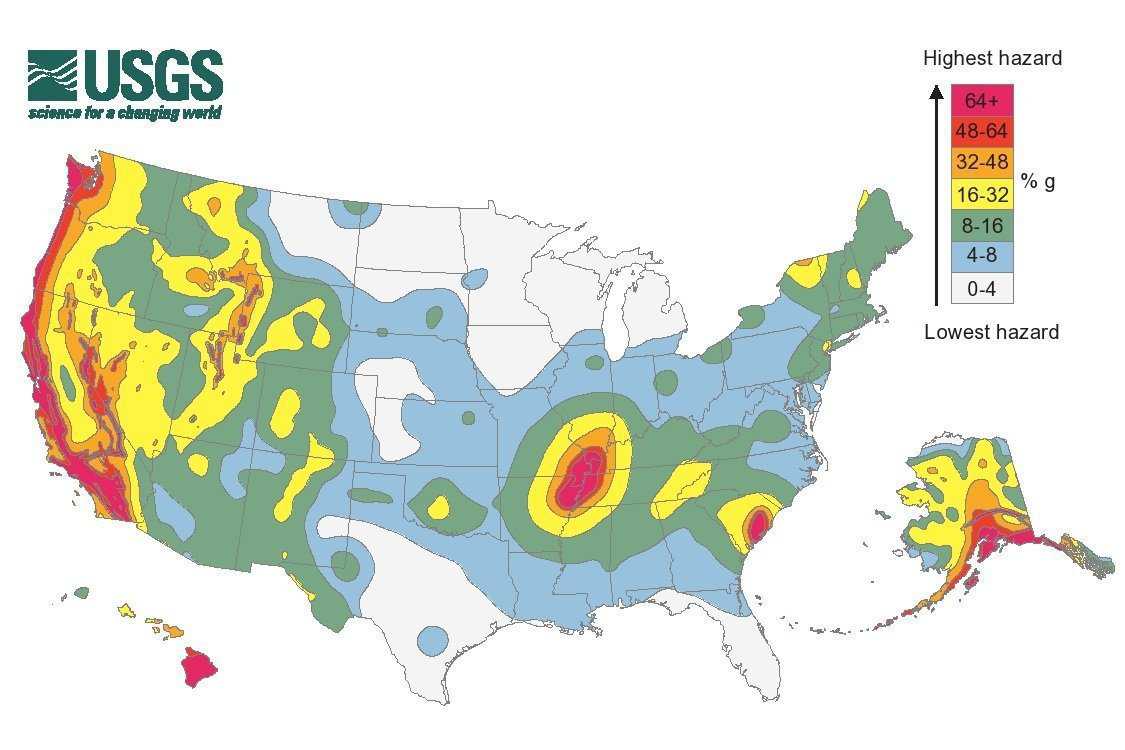
US Geology Survey National Seismic Hazard Map —These maps are based on current information about the rate at which earthquakes occur in different areas and on how far strong shaking extends from earthquake sources. Colors on this particular map show the levels of horizontal shaking that have a 2 % chance of being exceeded in a 50 year period. Shaking is express as a percentage of g (g is the acceleration of a falling object due to gravity). Areas in red have a much higher likelihood than areas of white to be exceeded, for example.